

Data Analytics vs Statistics: Differences & Business Value
Data analytics and statistics are both essential tools for extracting valuable insights from raw information. Although both fields involve scrutinizing data to uncover underlying trends and patterns, their core methodologies, tools, and overall objectives differ significantly.
Statistics relies heavily on mathematical models and probability theory to summarize sample data and test hypotheses. In contrast, data analytics encompasses a broader range of techniques, turning complex data into actionable business intelligence. Understanding how these two disciplines complement each other helps organizations leverage their data assets to drive informed, strategic decisions.
Understanding the Basics of Data Analytics
Data analytics is the multi-step process of inspecting, cleaning, transforming, and modeling raw data to discover meaningful patterns and support strategic decision-making. By leveraging advanced statistical techniques, machine learning algorithms, and data mining tools, analytics converts raw dataset inputs into reliable operational strategies.
Beyond raw computation, modern analytics relies heavily on data visualization tools such as interactive dashboards, charts, and graphs. These visual representations translate technical outcomes into clear, executive-ready insights. By partnering with professional data analytics services, enterprises can optimize workflows, uncover operational bottlenecks, lower overall costs, and maximize profitability. Transform complex data into business value.
Knowing more about the Basics of Statistics
Statistics is a core branch of mathematics dedicated to collecting, organizing, analyzing, interpreting, and presenting quantitative data. Statistical methods gather information through structured surveys, controlled experiments, and observational studies, applying mathematical theories to draw valid conclusions about larger populations.
This quantitative foundation is vital across fields such as science, economics, healthcare, and market research. Statistics provides the framework for measuring uncertainty, assessing risk, and determining whether observed patterns represent real phenomena or random noise. By establishing mathematical correlations between variables, statistics delivers the empirical grounding needed for rigorous research and evidence-based planning.
Data Analytics vs Statistics: Key Differences
While both disciplines work with data to guide decision-making, their focus, tools, and execution models differ in several fundamental ways:
- Scope and Application: Statistics focuses on building and validating mathematical models using probability theory and sample populations. Data analytics applies these mathematical tools alongside modern software to solve practical enterprise problems.
- Tools and Technologies: Statistical analysis relies on mathematical formulas and specialized software like R or SPSS. Data analytics incorporates big data platforms, automated pipelines, and machine learning models to process massive datasets efficiently.
- Visualization and Communication: Statistics prioritizes mathematical accuracy and formal statistical significance. Data analytics emphasizes intuitive dashboards and visual reporting to communicate findings directly to non-technical business stakeholders.
Building an Effective Data Analytics Framework for Business
To transform raw numbers into strategic advantages, organizations must build an effective data analytics framework that bridges statistical rigor with scalable software execution. A robust data analytics framework ensures that data flows seamlessly from initial ingestion to final executive reporting.
This framework guides how data moves across the organization, supporting both exploratory analysis and predictive modeling. When properly structured, it aligns technical data operations directly with overarching business goals, ensuring every insight yields measurable enterprise value. Need clear data insights for growth? Intone turns raw data into clear, actionable business strategies.
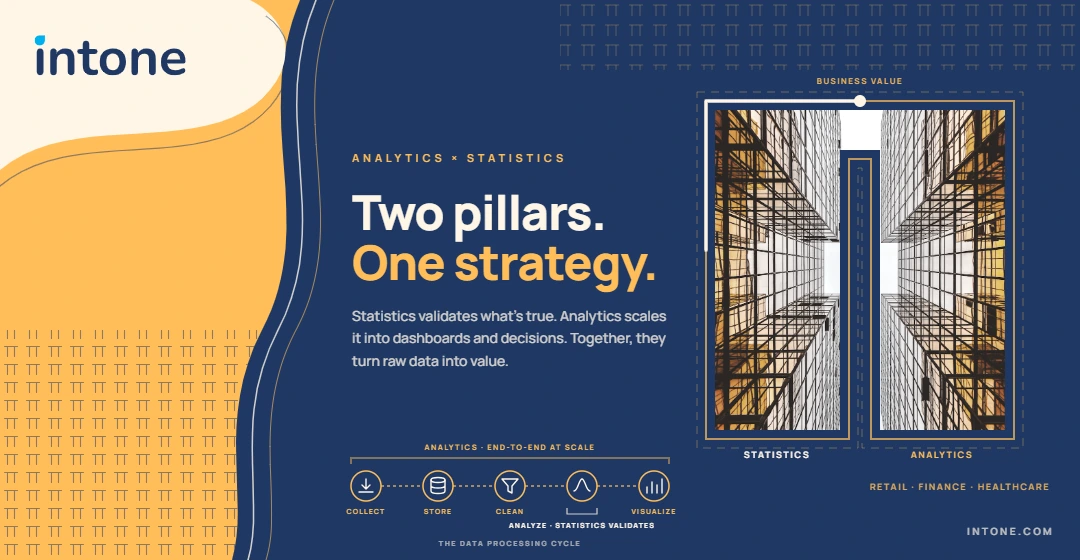
Key Stages of the Data Processing Cycle
An enterprise framework relies on a structured data processing cycle to handle complex information across distinct operational stages:
- Collection: Gathering structured and unstructured raw data from operational software, customer interactions, and third-party systems.
- Storage: Securing information within centralized cloud data warehouses or data lakes to guarantee high data quality and system availability.
- Processing and Cleaning: Filtering, normalizing, and transforming raw records into clean, reliable formats for downstream analysis.
- Analysis and Modeling: Applying statistical testing, regression models, and machine learning algorithms to reveal hidden patterns.
- Visualization and Distribution: Formatting analytical findings into executive dashboards and actionable reports.
Proper enterprise storage and continuous governance protect data integrity throughout these stages, preventing corrupt or incomplete data from skewing strategic forecasts.
Real-World Business Impact and Case Studies
Examining real-world case studies illustrates how combining statistical validation with modern analytics drives scalable commercial success across diverse sectors:
- Retail & E-Commerce: Global retailers combine statistical regression models with machine learning to analyze customer purchasing behavior. These insights power dynamic pricing, personalized product recommendations, and optimized inventory stocking.
- Financial & Administrative Services: In financial operations and administrative services, statistical risk models quantify loan default probabilities. Concurrently, real-time analytics platforms monitor transaction flows to detect fraudulent activities instantly.
- Healthcare & Life Sciences: Medical research teams apply statistical hypothesis testing to validate clinical trial results, while healthcare operators use predictive analytics to forecast patient admission rates and allocate hospital resources efficiently.
Modernizing legacy infrastructure through modern data management services allows companies to connect isolated data sources, maintain rigorous governance, and accelerate their digital modernization initiatives.
Integrating Analytics and Statistics for Business Success
Statistics and data analytics are not competing approaches; rather, they are complementary pillars of a modern, data-driven organization. Statistics provides the mathematical foundation and theoretical validation required to ensure findings are trustworthy. Data analytics supplies the computational power, software integration, and visualization tools needed to apply those findings at scale.
By establishing an enterprise framework that unites rigorous statistical methodology with modern analytics workflows, businesses can eliminate guesswork, streamline operations, and continuously optimize performance in a competitive global market. To explore how these methodologies compare in greater depth, read our full guide on data analytics vs statistics.
FAQ’s
Statistics focuses on using mathematical theory and probability to analyze samples, test hypotheses, and draw conclusions about a larger population. Data analytics is broader in scope—it uses statistical principles alongside modern software, big data platforms, and machine learning to analyze large datasets and deliver actionable business intelligence.
No. Statistical concepts—such as probability, correlation, regression, and sampling—form the underlying foundation of data analytics algorithms. While data analytics relies on automation, big data pipelines, and visual dashboards, it requires statistical validation to ensure that patterns in the data are accurate and not just random noise.
Statistical analysis generally relies on specialized statistical software and programming environments such as R, SPSS, SAS, and Stata. Data analytics incorporates these tools alongside broader software platforms, including data visualization tools (Tableau, Power BI), database languages (SQL), programming languages (Python), and cloud data warehouse environments (Snowflake, BigQuery).
Statistics provides the theoretical rigor needed to ensure insights are reliable, while data analytics scales those insights across business operations. For example, in e-commerce, statistical models validate whether a marketing campaign caused a real rise in sales, while data analytics platforms run the real-time algorithms that power personalized product recommendations for millions of users.
A structured data analytics framework manages the end-to-end lifecycle of data—from collection and cloud storage to cleaning, analysis, and dashboard visualization. It ensures data governance, protects data quality, and aligns technical analytical workflows directly with strategic business objectives.